
How to create a performance report including multiple time periods
Through Blueleaf's custom reporting feature, you can generate a report to compare performance returns for up to 4 different time periods. Below is an example of what it'll look like.

-
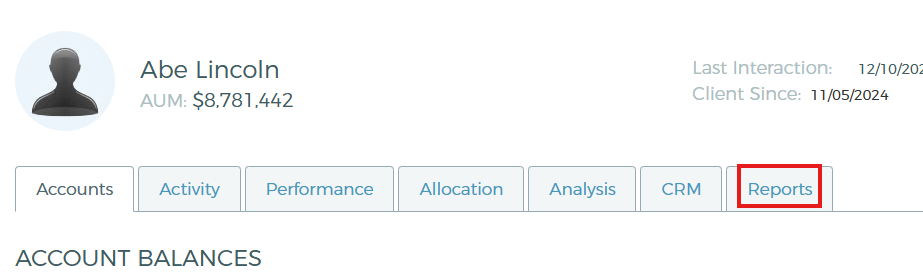
Start by searching for a household, then click on the Reports tab.
-
If you haven't created a report template before, you can start from scratch by selecting "create new template". If you have an existing report template, you can select it here and modify it.

-
To create a performance report with multiple time periods, you'll want to use the "multi-period performance" module. You can also drag and drop other report modules as you see fit. To see what the report module looks like, click "preview".

-
Next, click "configure date ranges" to set up the dates that you want to report on

-
Next, select the date range you want to report on (since inception, year to date, etc). You can select "fixed date range" if you want to specify a start and end date, and you don't want the dates to change. You can also customize the label for each date range, for example "Q2 2024" instead of displaying the dates "04/01/24 - 06/30/24"

-
Lastly, you can save the report template for later use by clicking "save template". To generate the report, click "preview & create report".


It's also easy to generate this report across multiple clients, instead of a single client. Below are some articles to help you get started: