
Creating & Editing Analytic Dashboards
Creating a Dashboard
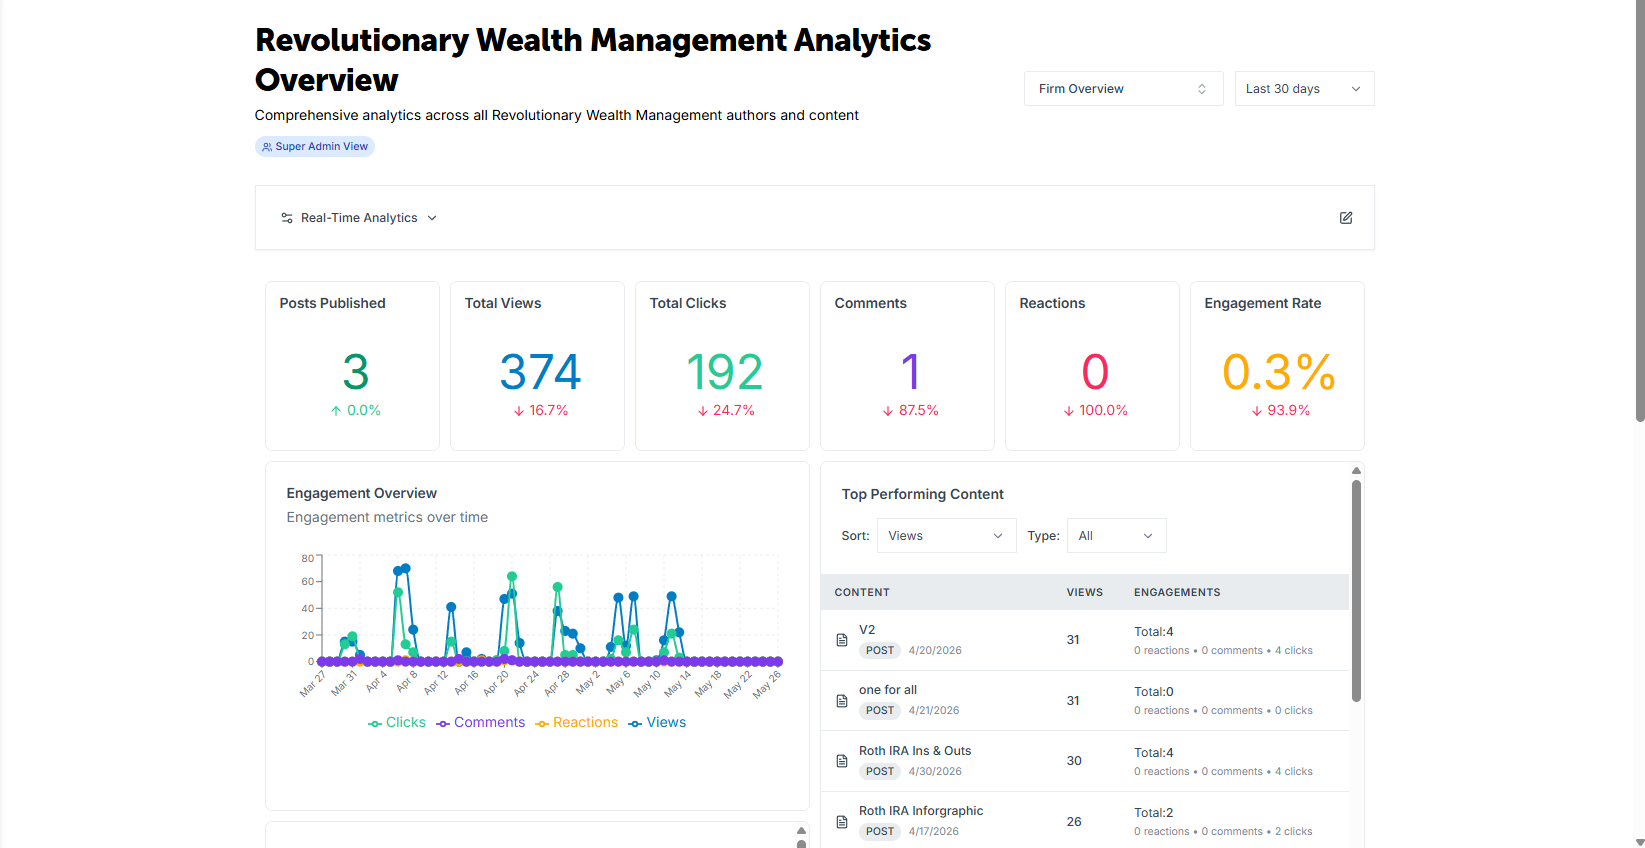
Engage helps you track your client's engagement through a variety of analytics available to you from the Dashboard. By default, you receive information such as the number of posts published, your total clicks, when those clicks are happening, and what your top performing posts are.
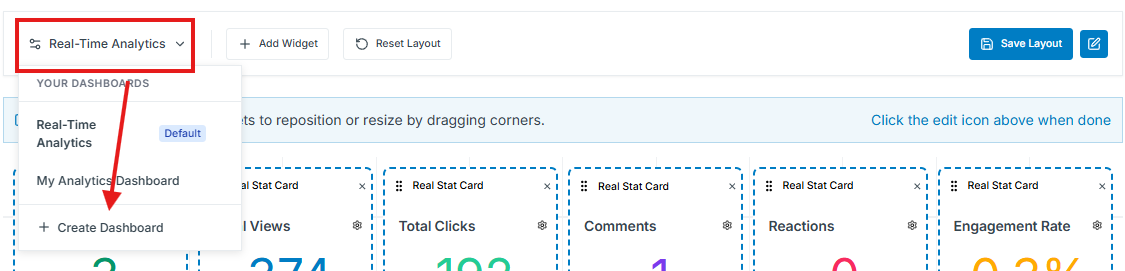
However, you can also create and edit dashboard analytics as you see fit. Click the drop down menu above the dashboard, then select "+ Create Dashboard" to make a new one.
Editing a Dashboard
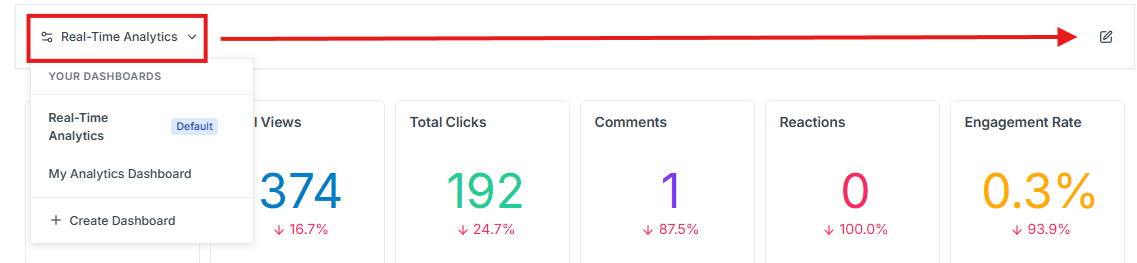
First, select your desired dashboard to edit from the drop down menu, just above the dashboard itself. Then, click the edit icon to the right.
Dotted lines around each widget indicates you are in edit mode. You can click and drag the widgets into different positions to suit your goals. By clicking the bottom right corner of each widget, you can also resize them.
To add a widget, click "+ Add Widget" next to the dashboard drop down menu to be given a list of available cards you can add to the dashboard.
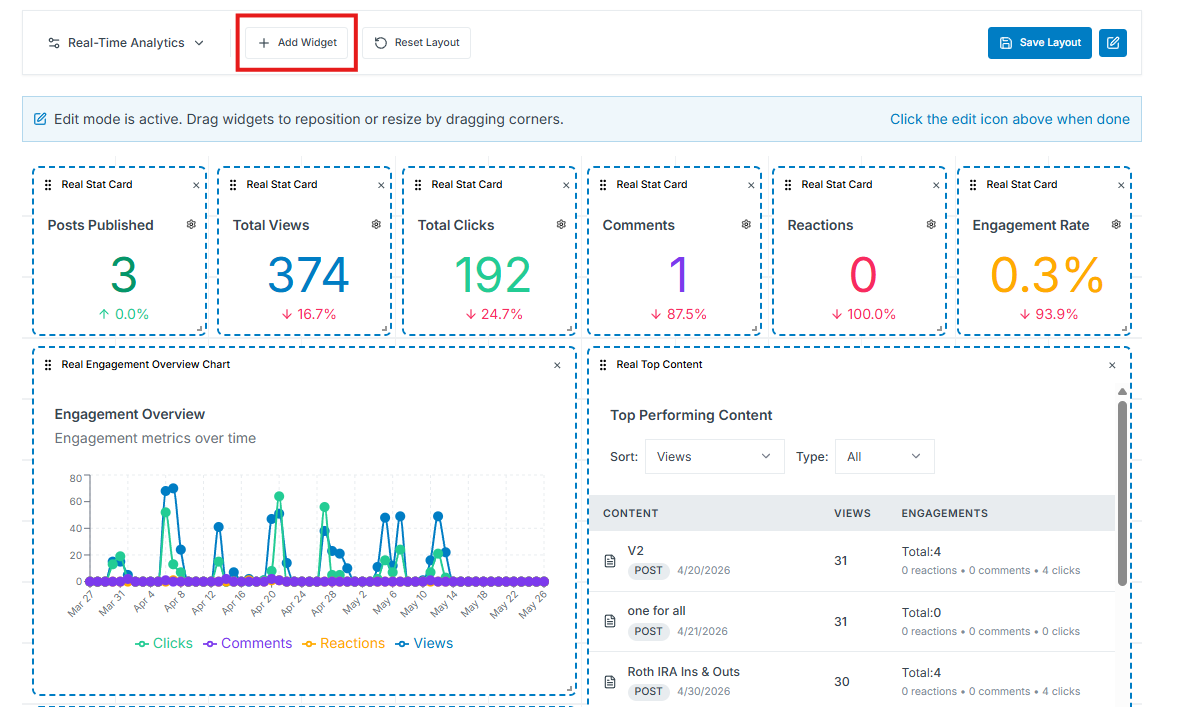
If you make a mistake, the "Reset Layout" button just next to the "+ Add Widget" button will revert the dashboard to the default and allow you to start over. Once you're satisfied with your dashboard, click "Save Layout" to confirm your edits. Check out our video below for a guided tutorial on the Engage Dashboard!